Analyzing US Research and Development Spending for Tidy Tuesday and SWD Challenge
Feb 10, 2019I’m attempting to kill two birds (or two twitter hashtags) with one stone here. This is my first attempt at analyzing a weekly #tidytuesday data set; additonally, it’s my first go at the the monthly #swdchallenge.
#TidyTuesday
The data for week 7 of Tidy Tuesday is a group of datasets that detail US federal research and development spending by agency.
## [1] "department"            "year"                  "rd_budget"
## [4] "total_outlays"         "discretionary_outlays" "gdp"
With there only being a a handful of features of the dataset, I thought first to see how R&D spending changed throughout time.
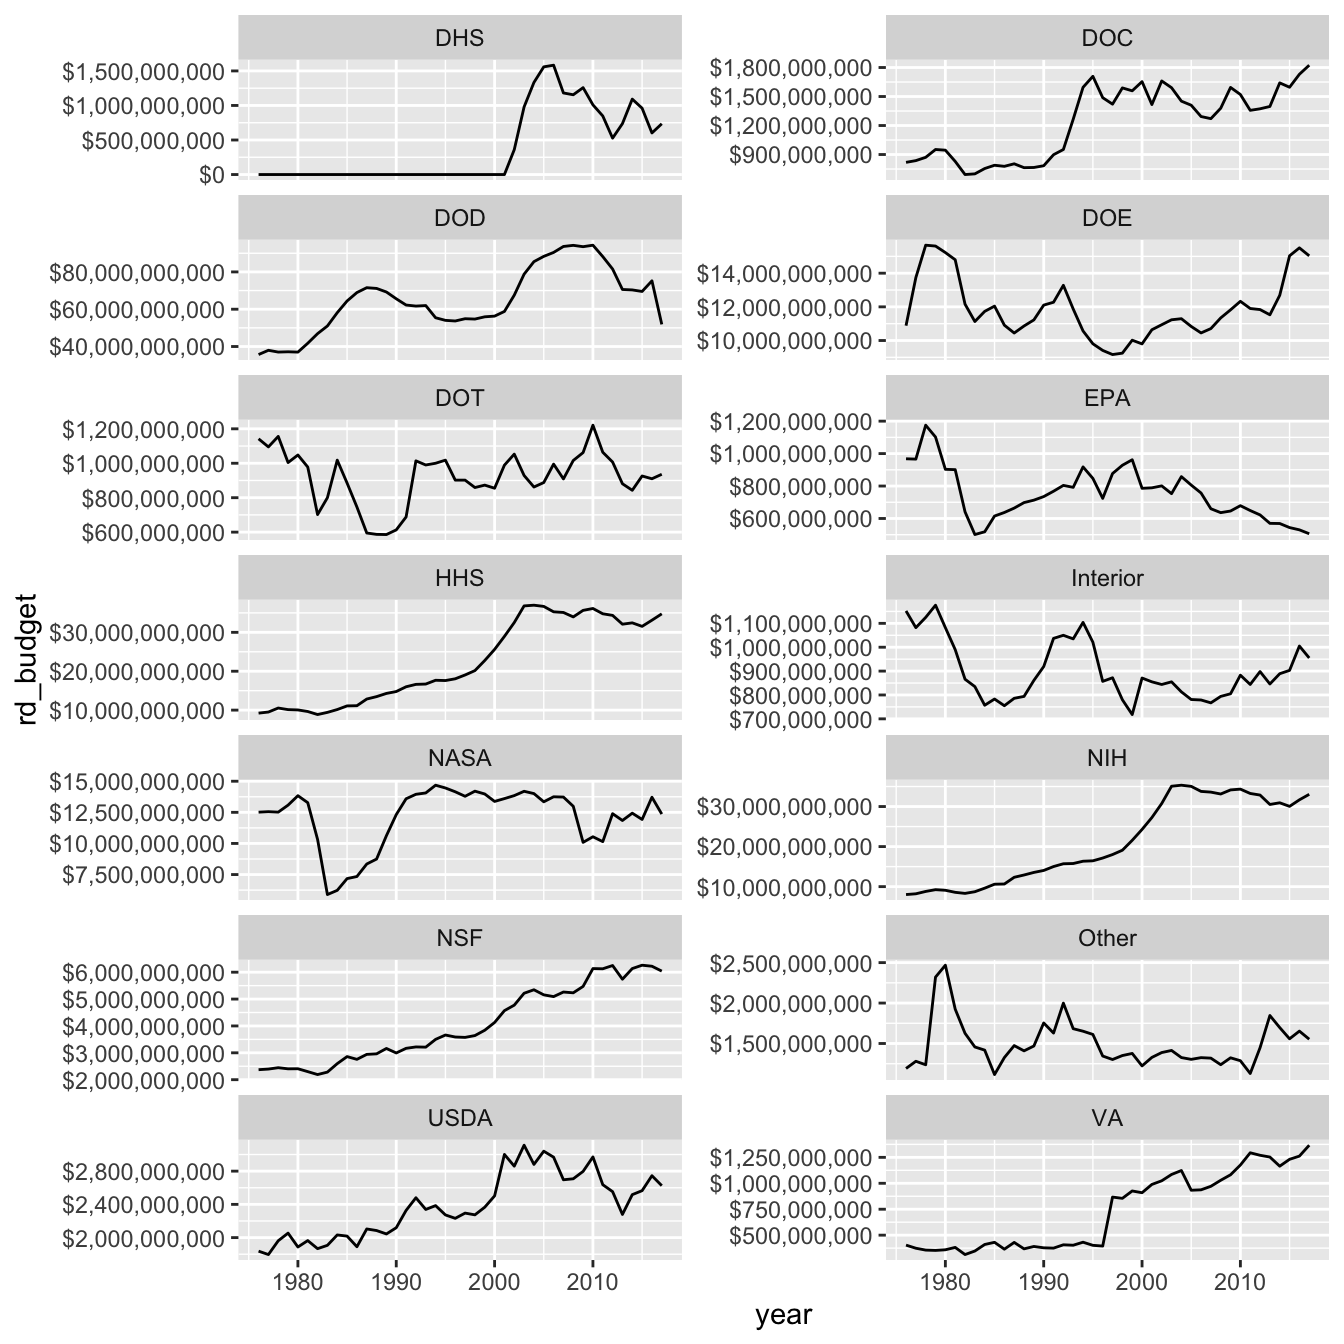
The first year for this data is 1976, and there are some clear trends here. Agencies like the NSF and HHS has have spent more and more since the 1980s, while agencies like the EPA and USDA have had a decline, particularly since 2000.
It’s easy to wonder how much partisan influence there might be on budget decisions, so I brought in presidents as a new variable.
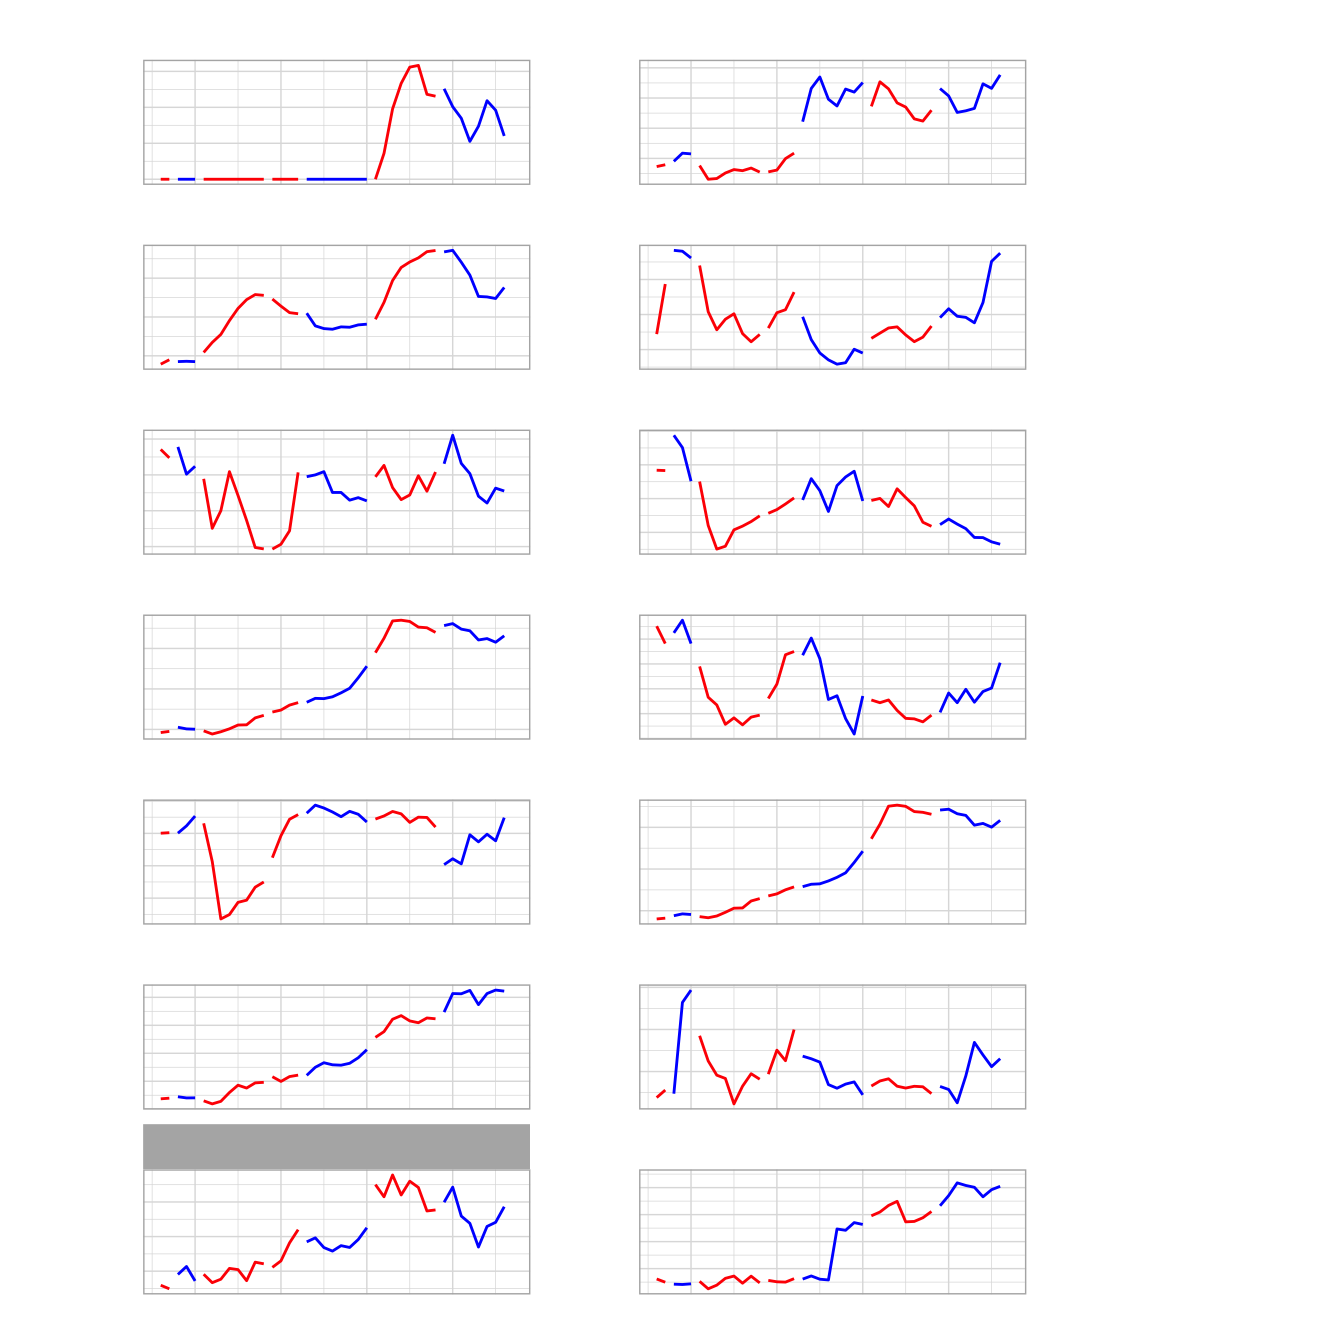
Some new inferences can be made here. Namely, large increases in defense(DOD) R&D spending have occured during republican presidencies.
#SWDChallenge
The Storytelling with Data challenge has to do with taking new approaches to vizualizing data. This month’s challenge was to vizualize the variance in a data set.
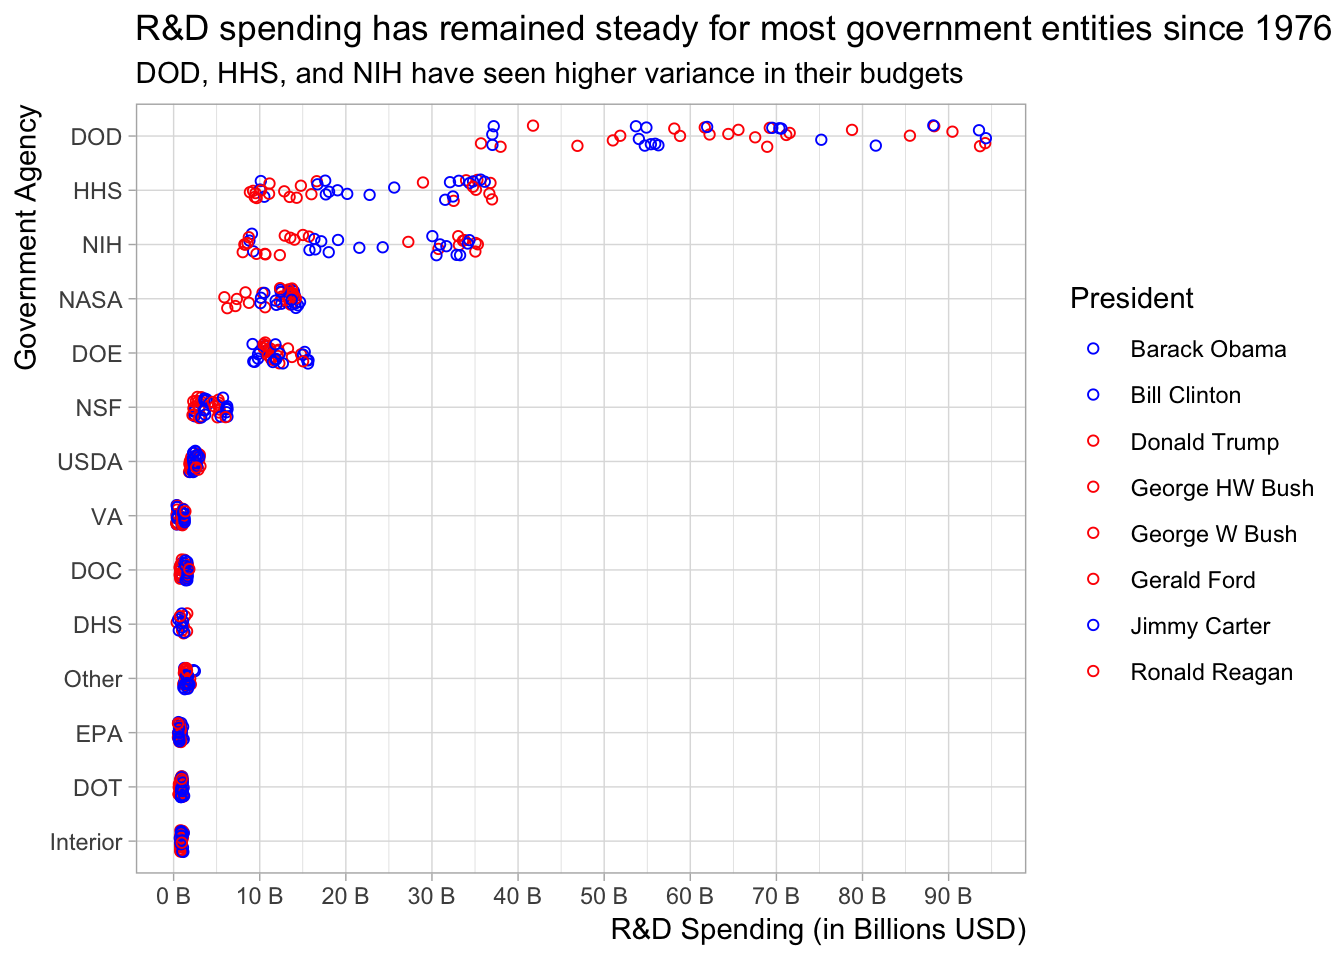
In spite of the R&D spending fluctuation that occurs across these government agencies, the majority haven’t seen a wide spread in spending between 1976 and 2017. This is not the case for agencies like DOD, HHS and NIH, who have see spreads of 50 Billion USD in research & development spending across 40 years.
The code for this blog can be found here